Visualizing Data Lake data in Tableau
Business Problem
While you can run queries directly in Data Lake Compass user interface or through your local SQL client through the JDBC driver, visualizing data sets can go a long way in helping with data exploration activities. Particularly, for machine learning applications, the first step is to usually get a sense of the data profile and perform full exploratory analysis before building a machine learning model.
Components
Requirements
- Access to an Infor CloudSuite
- User privileges to ION Desk (IONDeskAdmin) and ION API (IONAPI-Administrator)
Tutorial
In this tutorial, we’ll use Tableau to connect to Data Lake through the JDBC driver in order to explore and visualize data from a view created in an earlier tutorial as an example.
The Infor Technology Platform includes Birst, a built-in comprehensive analytics solution. Birst features a seamless integration with Data Lake and delivers templated industry-specific analytics, significantly reducing time-to-value.
The example highlighted in this tutorial serves to demonstrate ease of interoperability and integration with other 3rd party BI solutions.
1. Download the Compass JDBC driver:
The first steps is to download the latest Compass JDBC driver from ION Desk in your tenant. You can do so by navigating to ION Desk > Configuration > Downloads > Files > Compass JDBC Driver
2. Register the Compass JDBC driver in Tableau:
The downloaded Compass JDBC driver must be saved in the Tableau Drivers folder to unlock access to this driver in the connection options. For more information on where to find this folder and how to connect to custom JDBC drivers, refer to the Tableau documentation here.
3. Create and download security credentials for the JDBC connection:
Next, under Infor ION API > Authorized Apps, you’ll need to create an authorized backend services app for the JDBC driver or re-use an existing one to download the *.ionapi file containing your service account credentials.

Always contact your security or infrastructure team before creating an authorized app with credentials.
The JDBC connection can be configured with a simplified string authentication approach which embeds these credentials into a single URL string in this format:
jdbc:infordatalake://?ionApiCredentials=Encoded_StringWhere Encoded_String here is based on the contents of the *.ionapi credentials file.
4. Encode the URL ionapi content for the URL authentication string:
The URL encoding needed here can be obtained using different encoding or text editors. In this example, we’re using the open source text editor Notepad++ as demonstrated below.
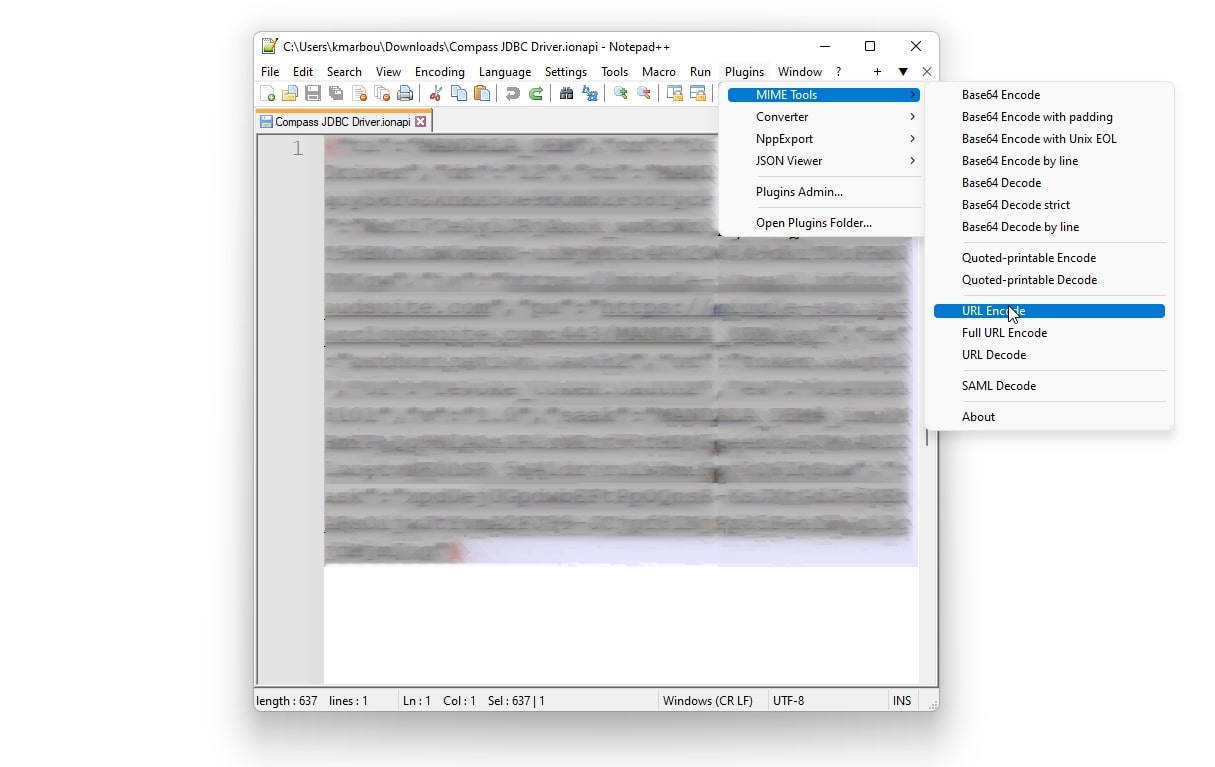
The resulting encoded string should start with a “%7B” representing the opening left bracket “{“ and end with “%7D” which is a closing bracket “}”.
5. Configure the JDBC connection in Tableau:
In Tableau, the connection can be initiated under: Connect > To a Server > Other Databases (JDBC), and by simply copy pasting the full URL string into the URL field and signing in.
6. Select schema and explore tables in Tableau:
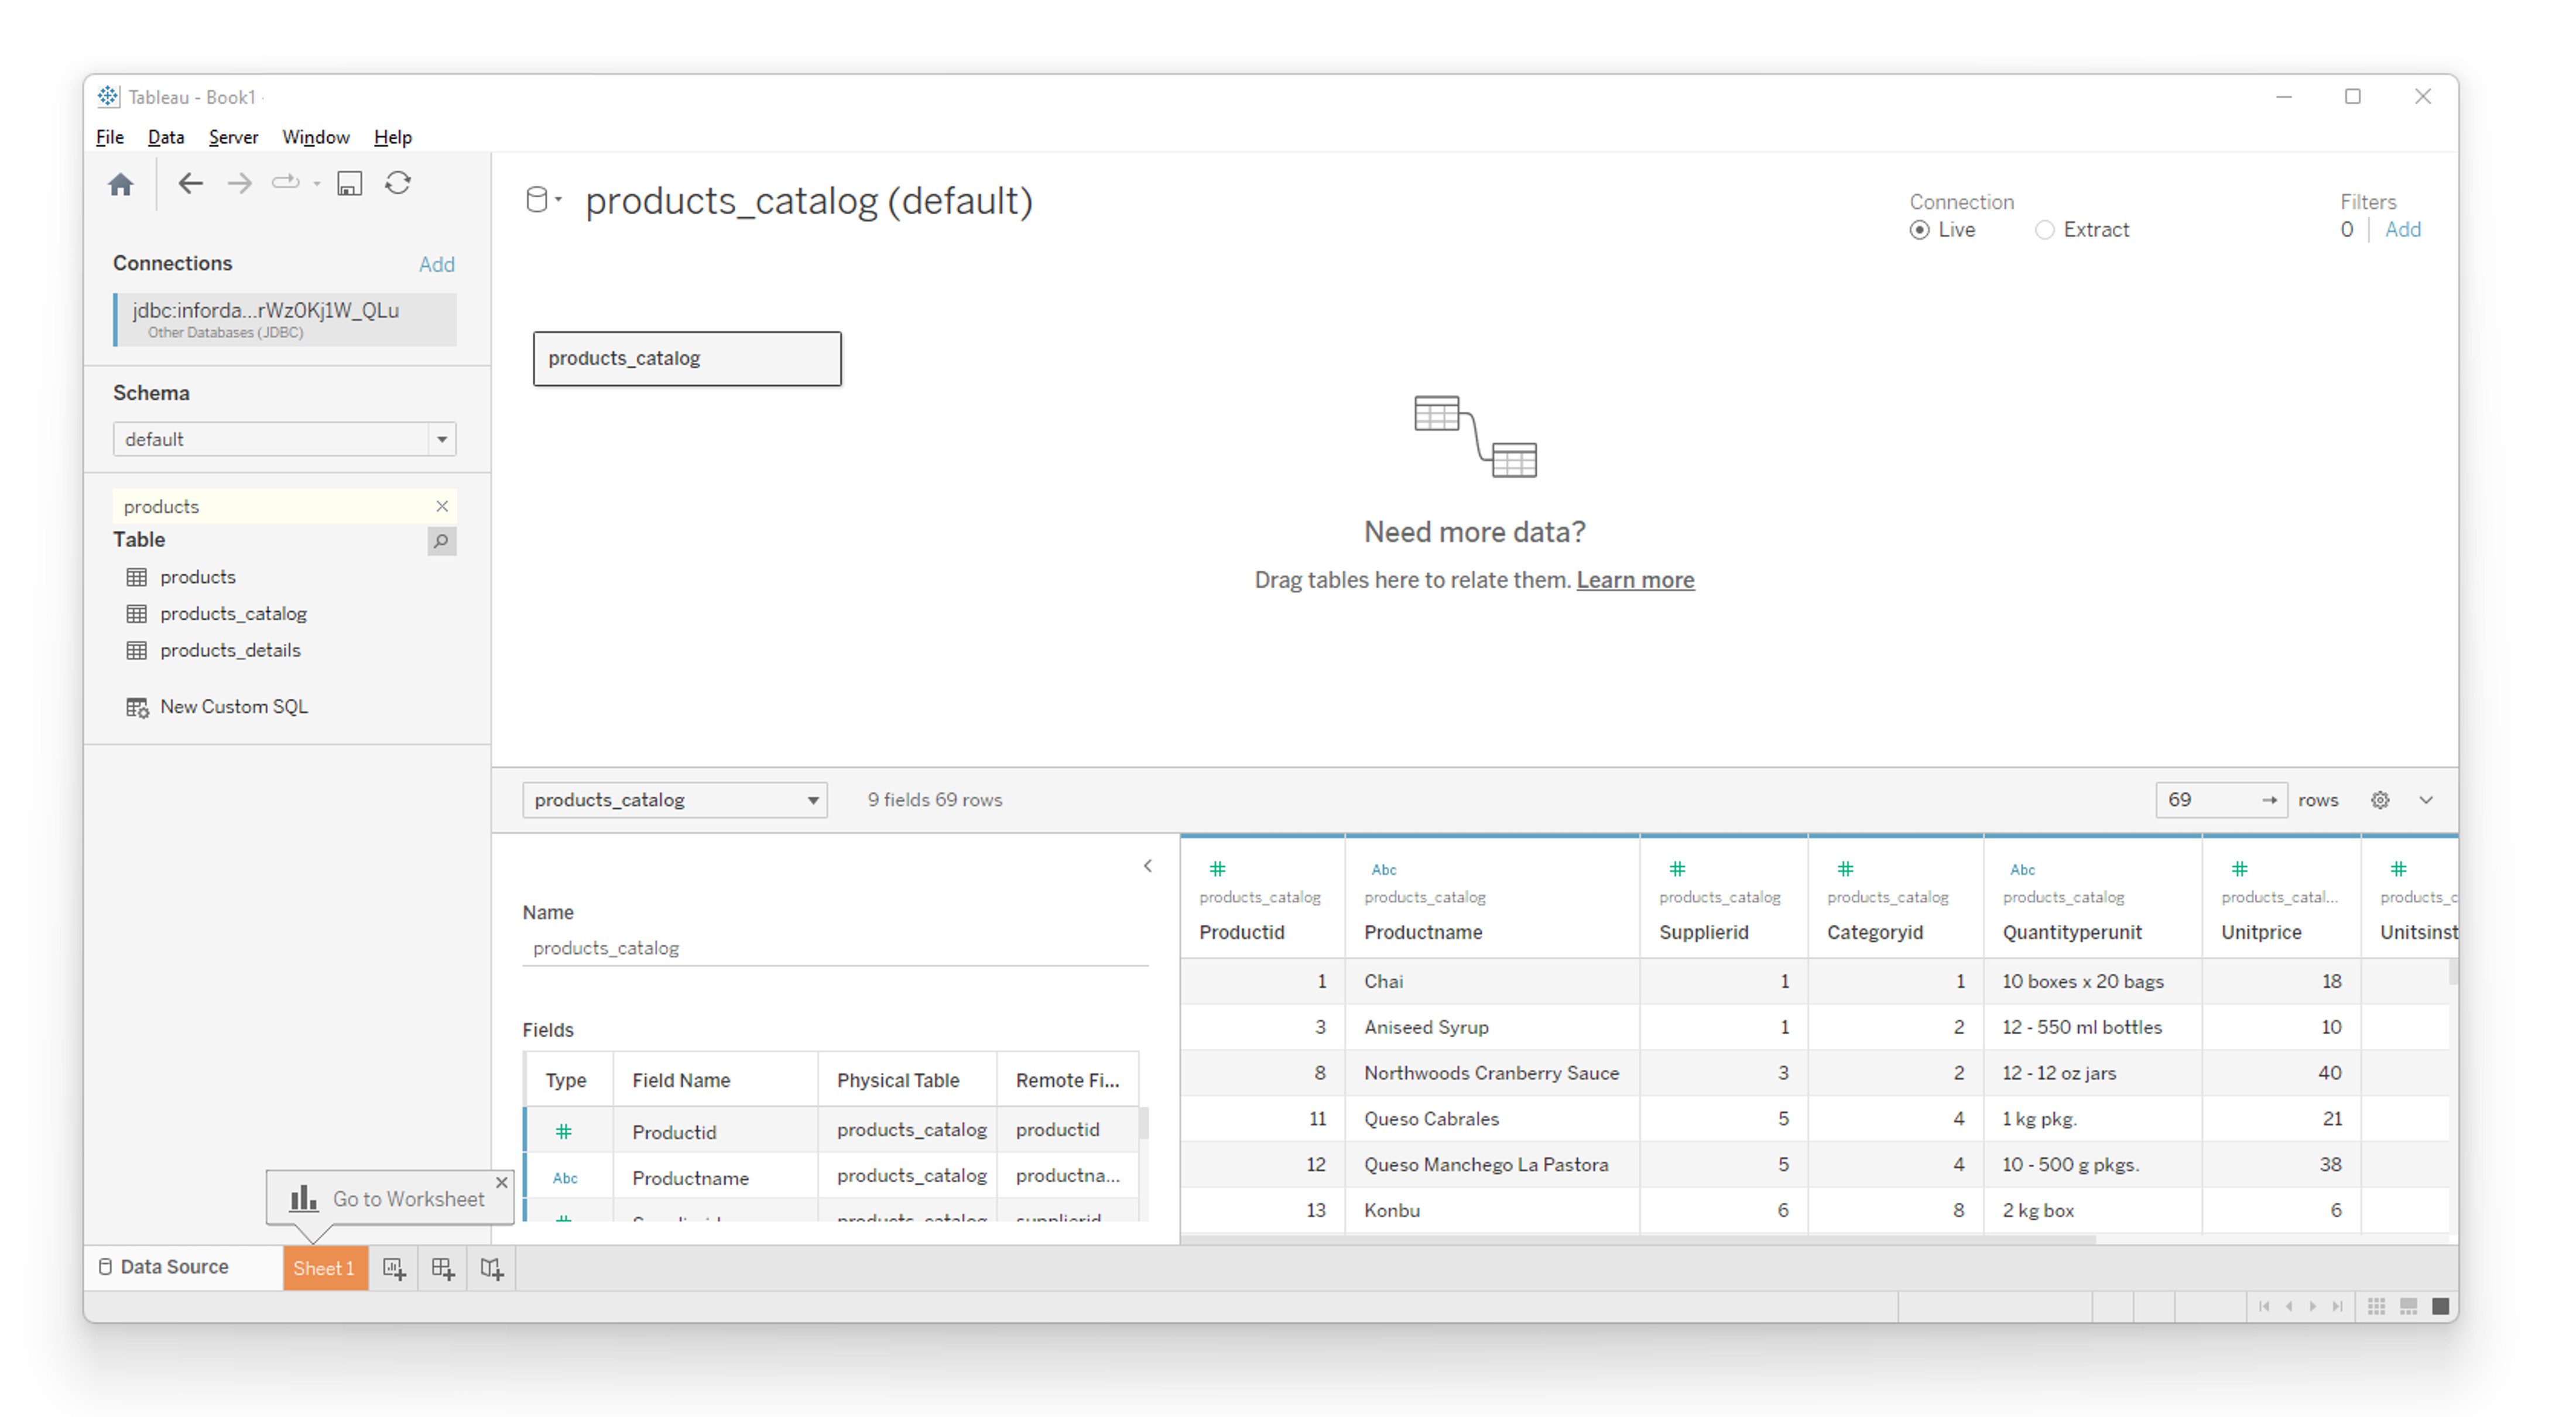
Once connected, you’ll be able to access a database-like view of Data Lake where you can select the Default schema to browse the available queryable data objects.
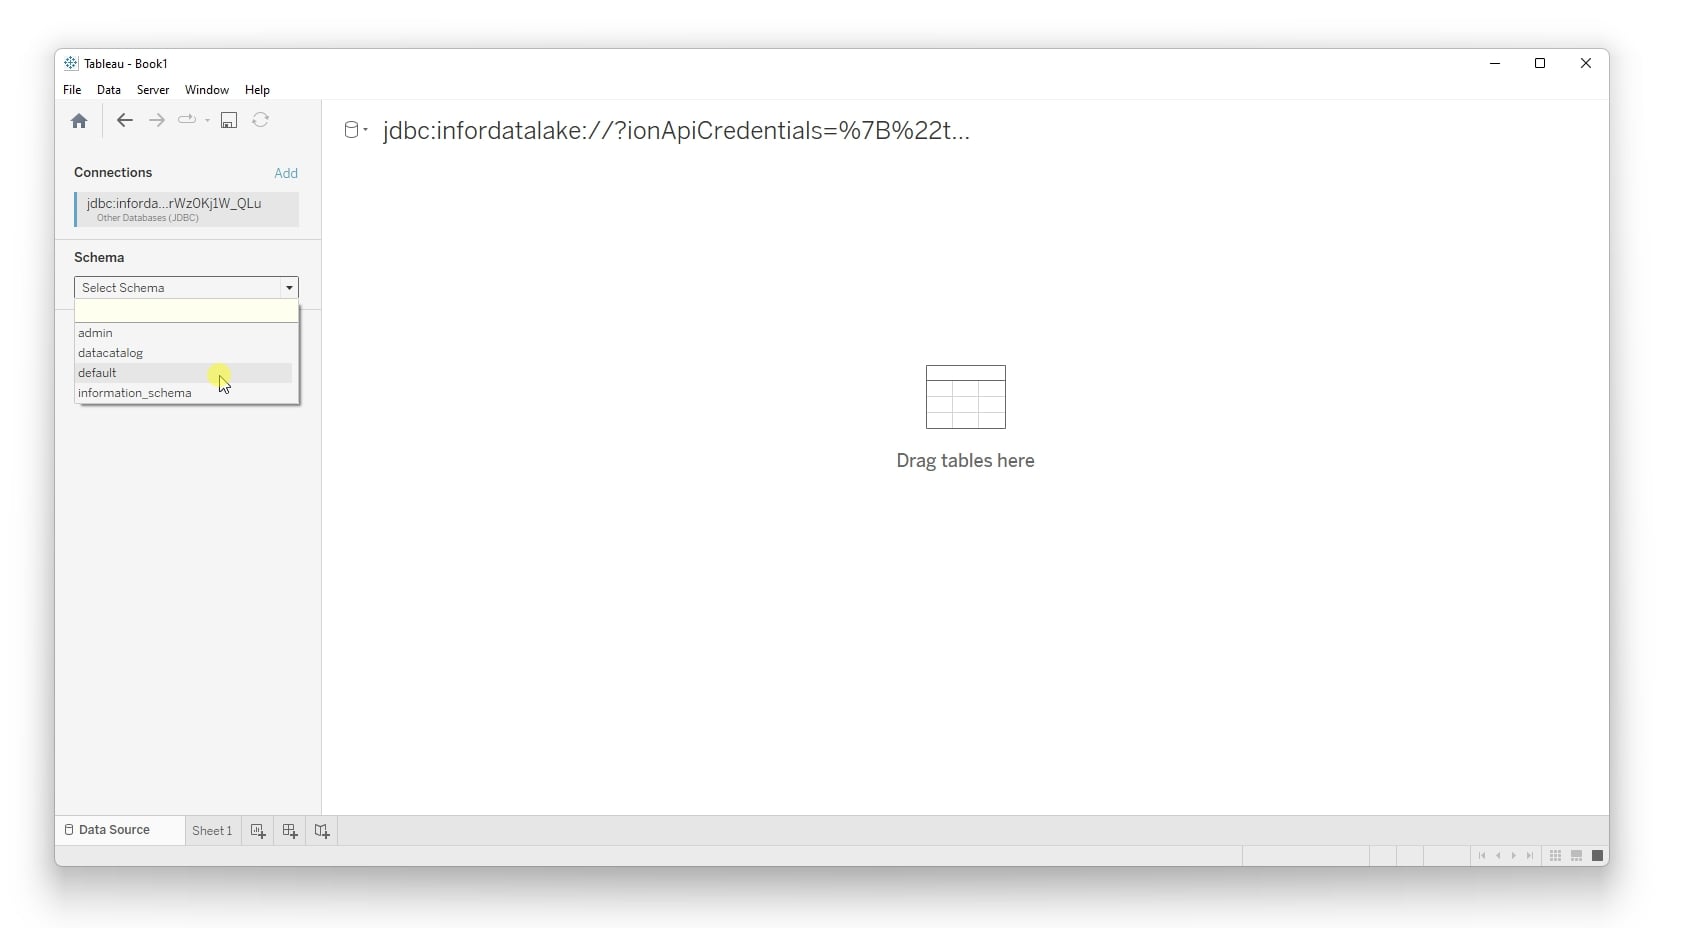
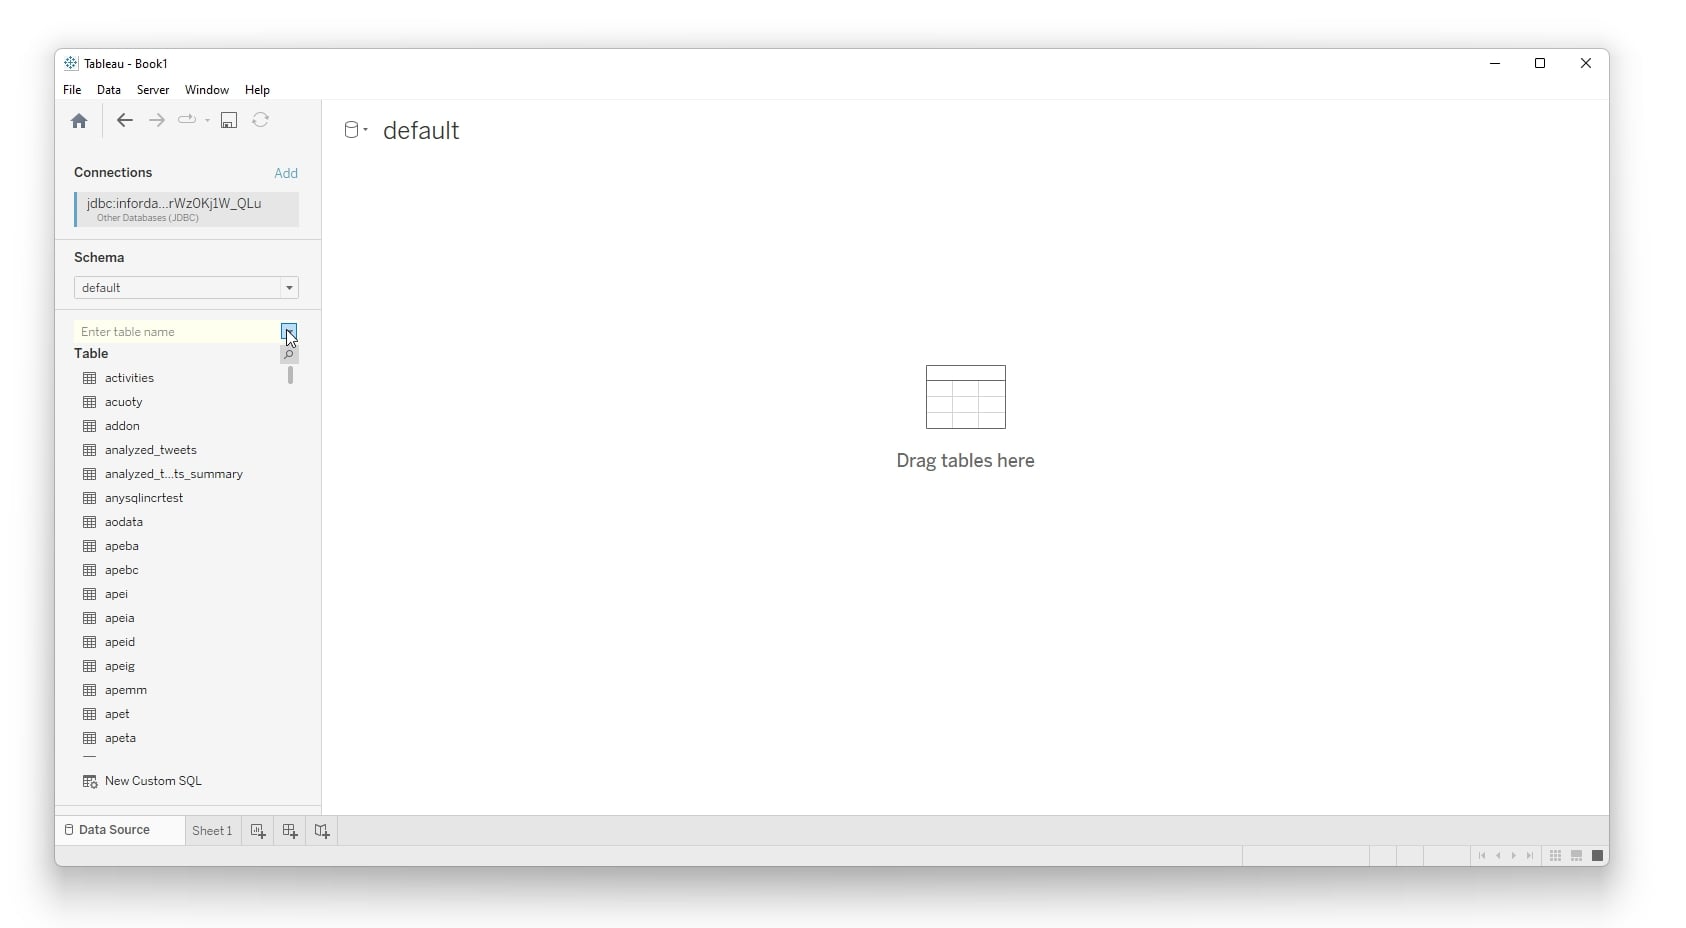
Next, we can select one or multiple tables to preview and build a data model.
7. Preview and model data in Tableau:
In this example, we’re focusing on a single table from a previous tutorial where we have a sample product catalog dataset.
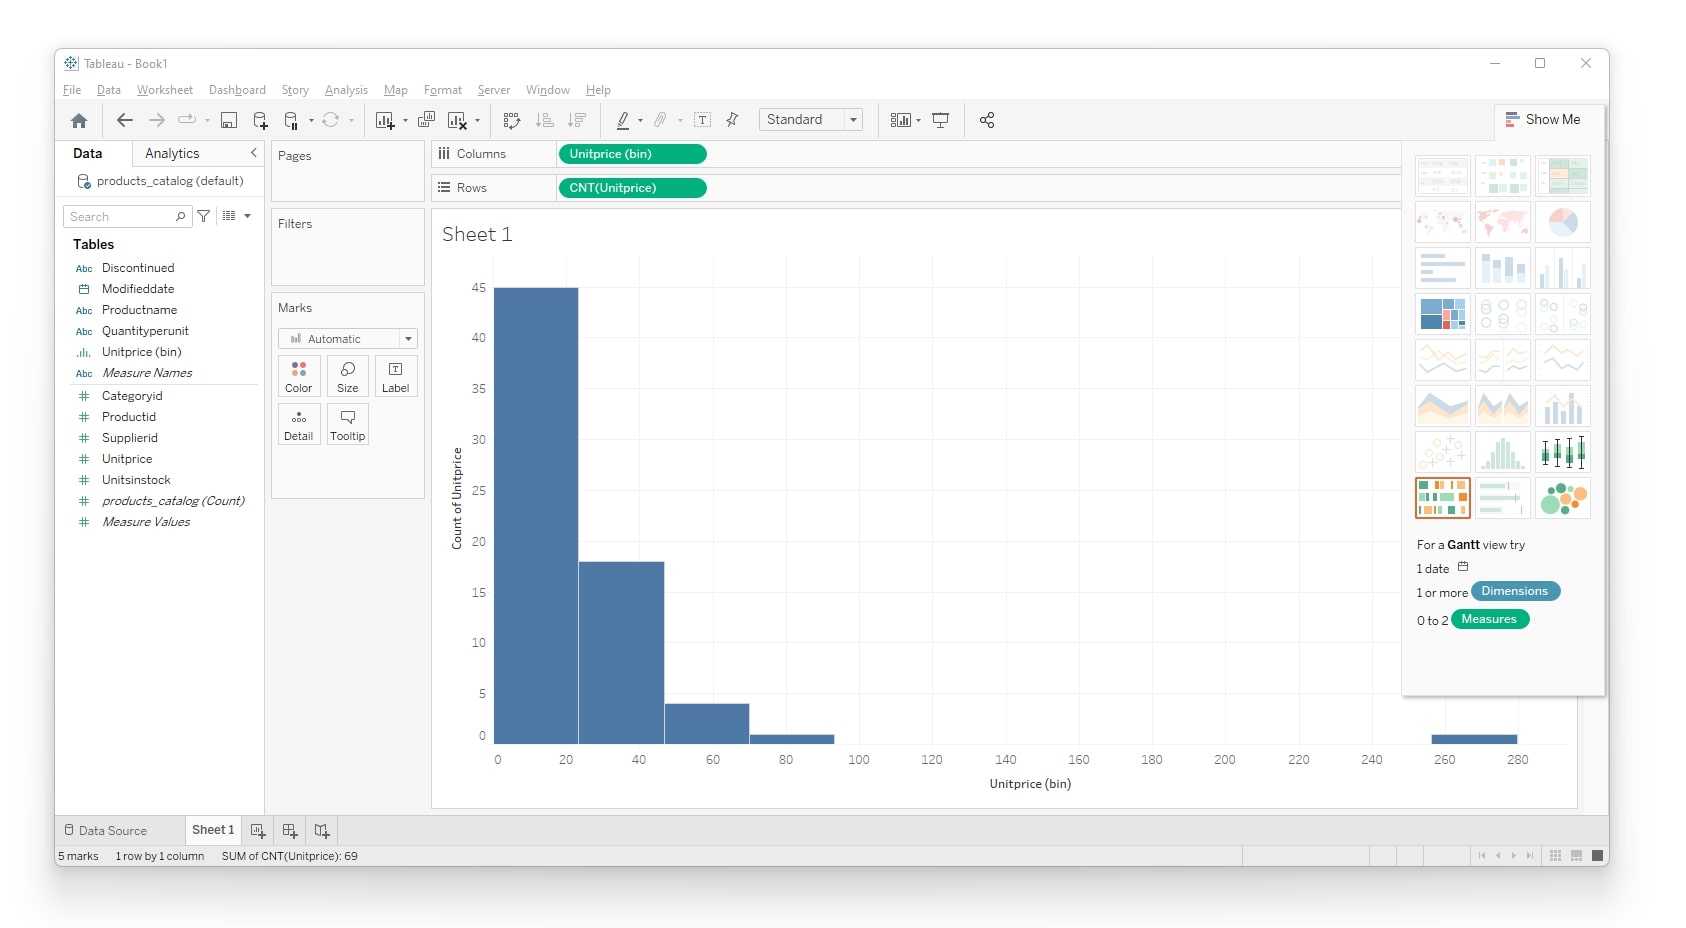
8. Create visualizations in Tableau from the loaded data:
With the data in place, we can proceed to build a sample visualization in a new worksheet. In the example below, we are looking at a simple statistical distribution of the unit prices across our product catalog dataset.