Customer Segmentation
Business problem
Treating all of your customers the same is not usually a great business strategy. Customers can be very different, but with large numbers of customers there are bound to be groups of similar ones. By segmenting a customer set into groups, business decisions can be made to address different types customers appropriately.
Scenario: A fictious big retailer chain operates a membership-model business where their customers pay an annual membership fee for access to their warehouse-like stores for great prices on bulk items.
Data: Being a membership business model, customer data is abundant in this scenario. Data includes demographic data on each customer, seasonal spend data, coupon history, and purchase history. This data is contained in multiple systems and multiple tables across the enterprise. There will need to be a data consolidation effort to prepare the relevant information for the machine learning model. We will walk through the implementation with this sample customer dataset.
Tutorial
Difficulty: Medium
Estimate Time: 60 Minutes
Step 1: Create one or more dataset(s).
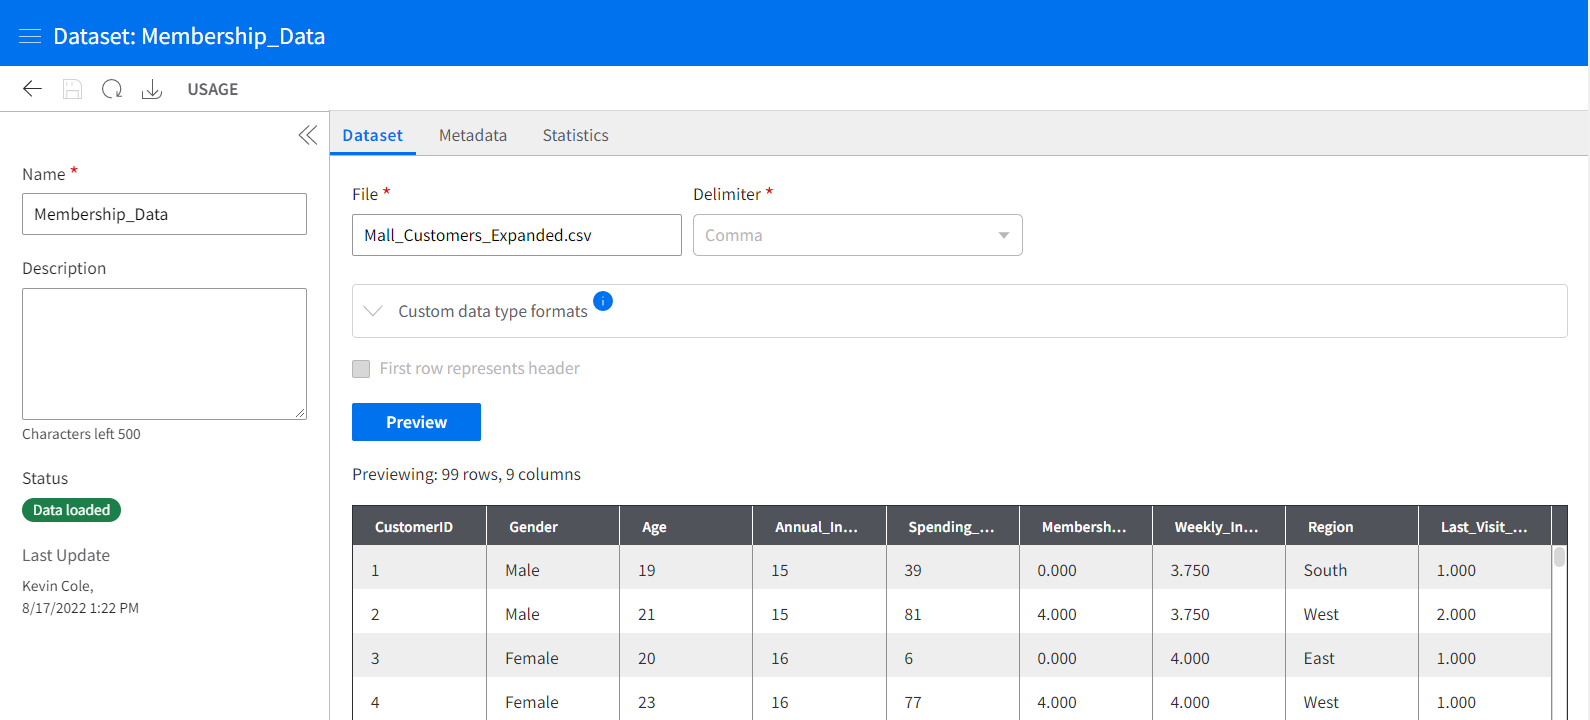
Using multiple datasets is perfectly fine, as your quest can refer to each dataset individually, get what it needs, and merge or manipulate data into its final form ready for the ML model. We will import this csv file for use with our sample, but your business data will likely live in the data lake.
Here you can see Infor AI giving us a preview of the dataset.
Step 2: Save the quest
In the Quests section of Infor AI, create, name, and save your new quest. This will create the blank canvas for your model to be developed.
Step 3: Import Data
Use an import data block, and within that block select the dataset you made in the prior steps. Once saved/run, you will be able to see the current state of the data at the output node on the right hand side of any given activity in the platform. Exploring your data will be important, as finding the oddities in the data now can help you know what prepare data steps are necessary. In my exploration of this sample dataset, I noticed the following:
- CustomerID is a unique identifier. It provides no information about the customer or their spending habits, and would not be a useful predictor of future behavior. We should not include CustomerID as a factor when creating customer groups or customers might be incorrectly grouped together because of their arbitrary position in the dataset.
- Gender, and Region in this dataset, are nominal (non-ordered) categorical variables. Categorical variables will need to be encoded regardless of how many items are in the categorization.
- Annual_Income and Quarterly_Income have a high correlation. In fact, Quartly_Income appears to be the Annual_Income divided by 4, creating a perfect correlation. You should avoid using both (all) when variable have a strong correlation, as it can overweight the importance of the feature.
- Last_Visit_Weeks has missing values. We will need to address this before using the feature. This could be due to a new membership being created before the customer has used their membership.
For more data manipulation information, visit the best practices document which can be found (((Insert link/document HERE))) and by adhering to tidy data standards.
Step 4: Cleanse data
Using the green prepare data blocks, you can engage in the data cleaning activities required to get your data ready for consumption by a model.
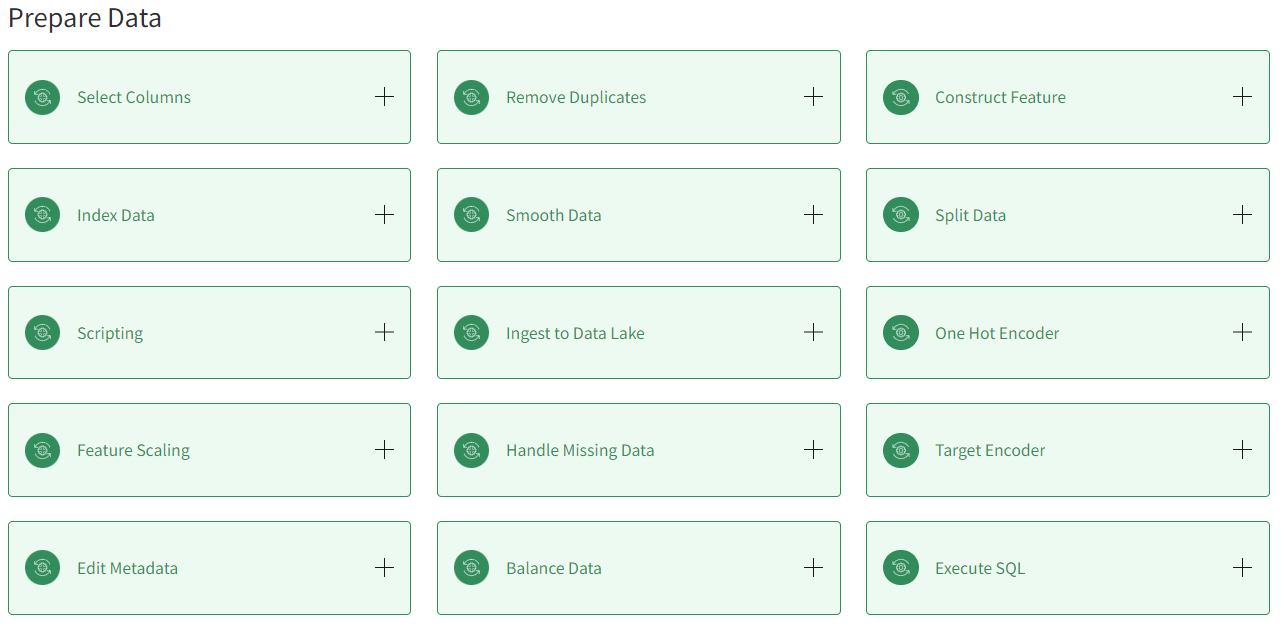
This blueprint addresses the bullet points in step 3 with the following decisions:
- CustomerID will be dropped
- Gender and Region will be encoded with One-Hot-Encoding. Features must first be identified as categorical
- Quarterly_Income will be dropped
- Last_Visit_Weeks missing values will be set to zero.
Step 5: Select a model.
Understanding which model to use and what its unique requirements are takes a bit of subject matter knowledge.
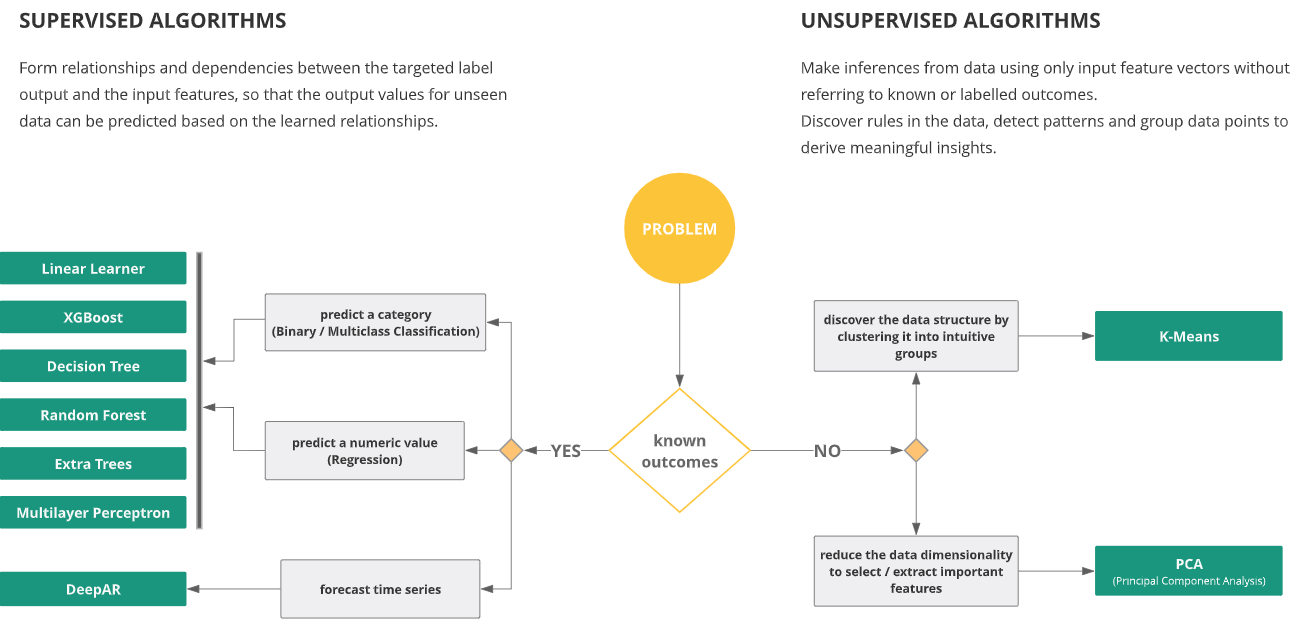
For the clustering project, we would select the K-Means clustering algorithm, or develop our own clustering algorithm using the custom algorithm functionality. Add the K-means block, or custom algorithm block to the quest.
Step 6: Set hyperparameters.
In the K-Means algorithm block, let the algorithm know how many columns you will be feeding it, and how many clusters should be created. You may optionally tweak other hyperparameters for performance tuning. This blueprint would set the Feature Dimensionality to 12 and K to 5.
Step 7: Train the model.
Use a train model block and pass in two inputs — the data that has been prepared, and the algorithm chosen. The quest should resemble the image below.
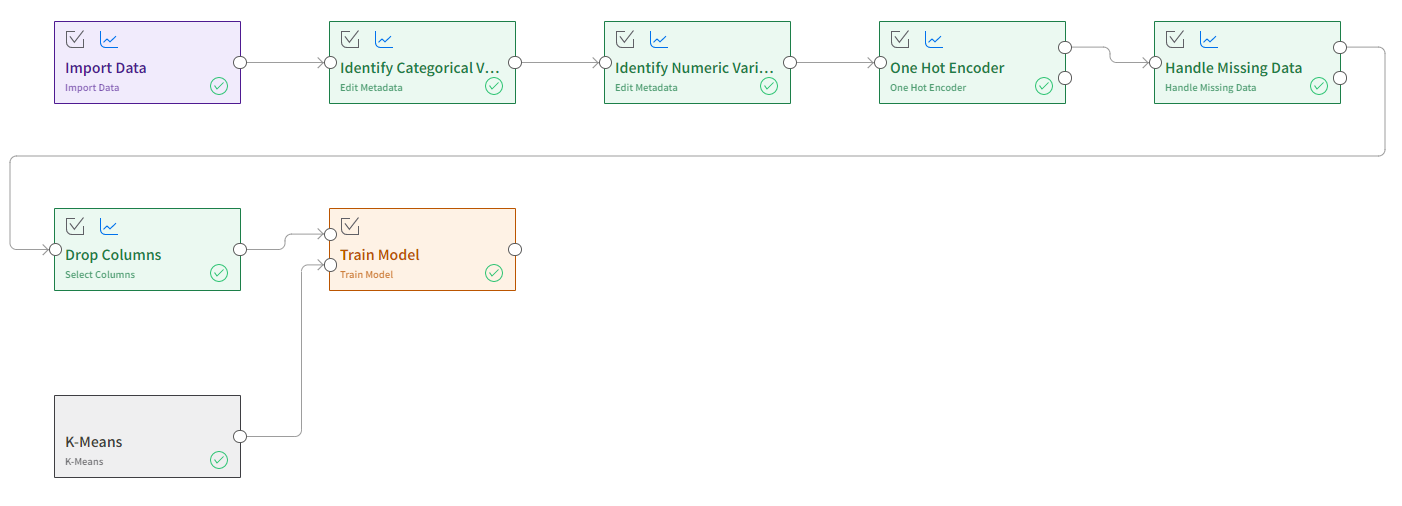
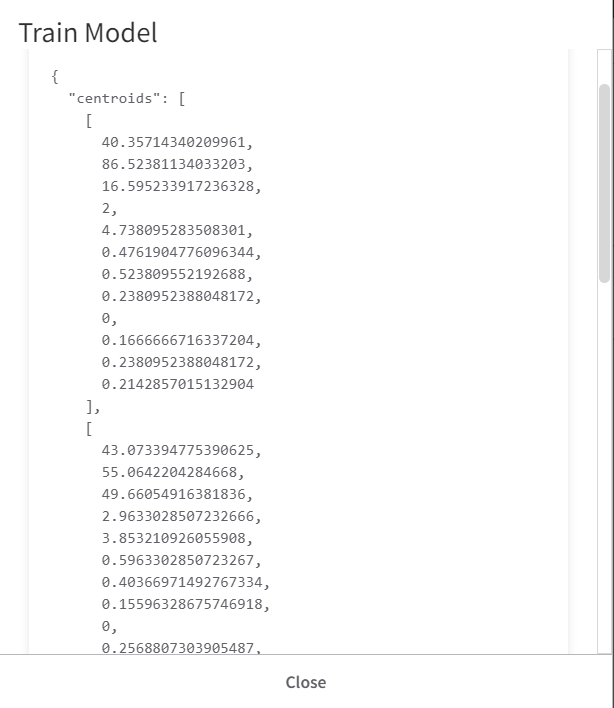
If successful, the node on the right of the train model block should contain information on the centroids of each cluster. These centroids don’t have practical meaning, but are multi-dimensional locations that a customer will be found closest to.
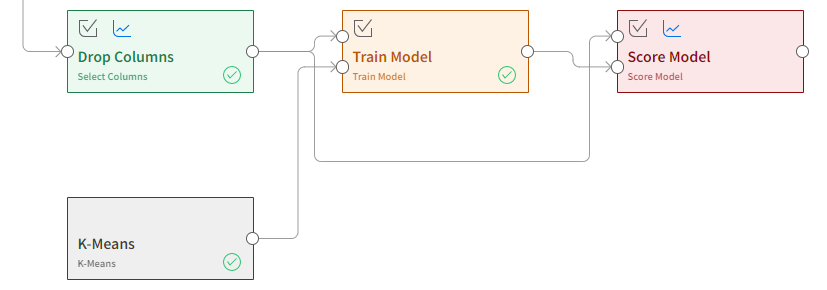
Step 8: Score the model.
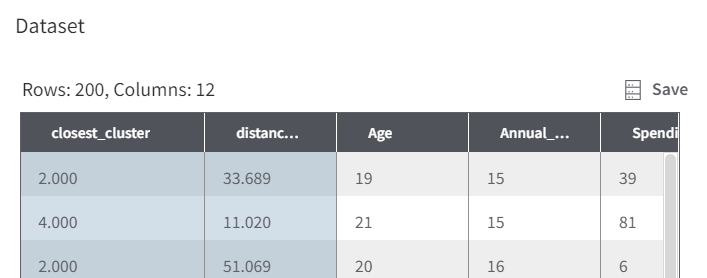
In this case, since the algorithm is an unsupervised learning application, there is no “truth” so accuracy metrics are not created, but giving the model the score model block will take the customers and assign each one to a cluster. The node on the right of the Score Model block will show the dataset and a new column identifying which cluster the customer belongs to.
Step 9: Deploy the model.
At the right of the toolbar, there is a checkmark for Auto-selecting activities for real-time production. This is the option we will use if we wish to have a deployed endpoint accessible via API. The batch production would be a better option for handling a large dataset for a single processing task. After using the auto-selection tool, or making sure the checkbox on each activity in the quest is checked, save the quest, then create a production quest.
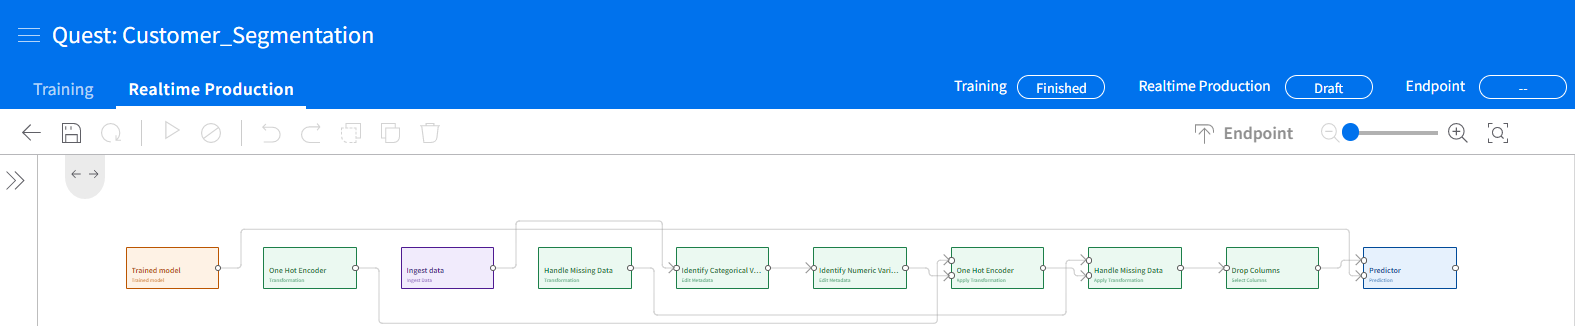
The production quest will look different, and that’s okay. Save the production quest, run it, and you will then be able to deploy it as an endpoint at the right of the toolbar. Follow the prompts to name and deploy the endpoint.
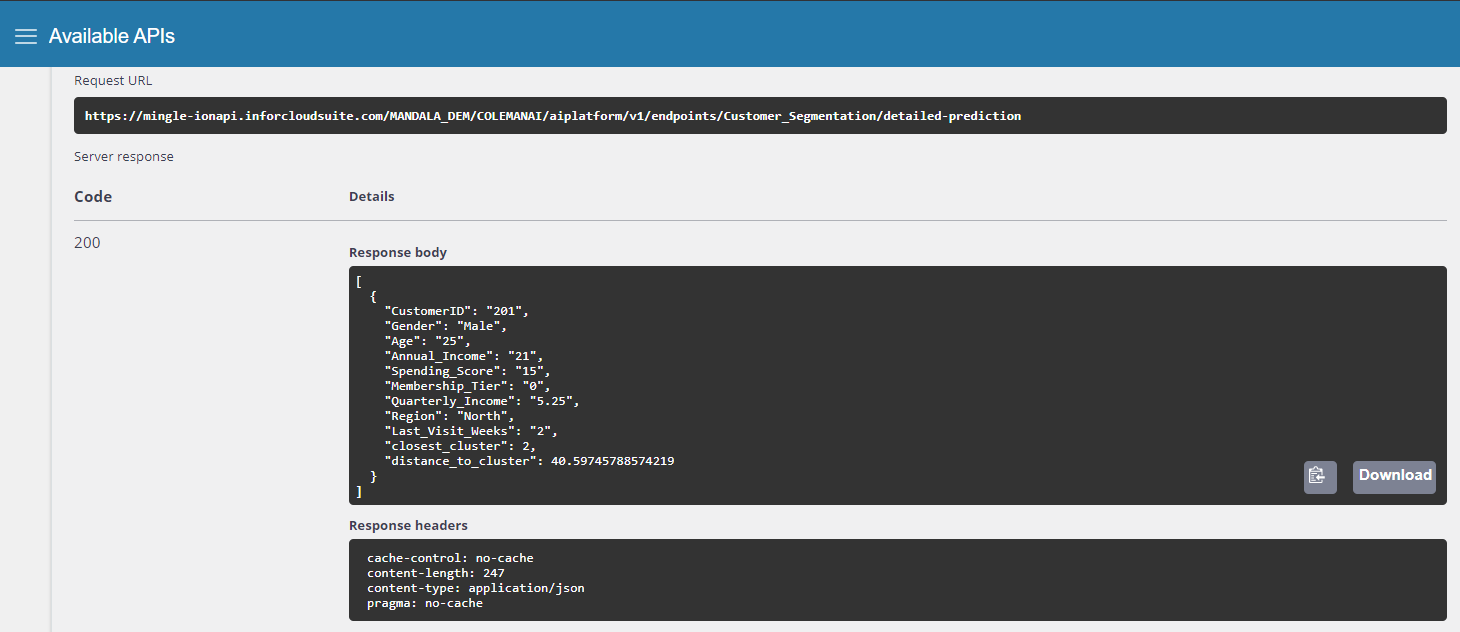
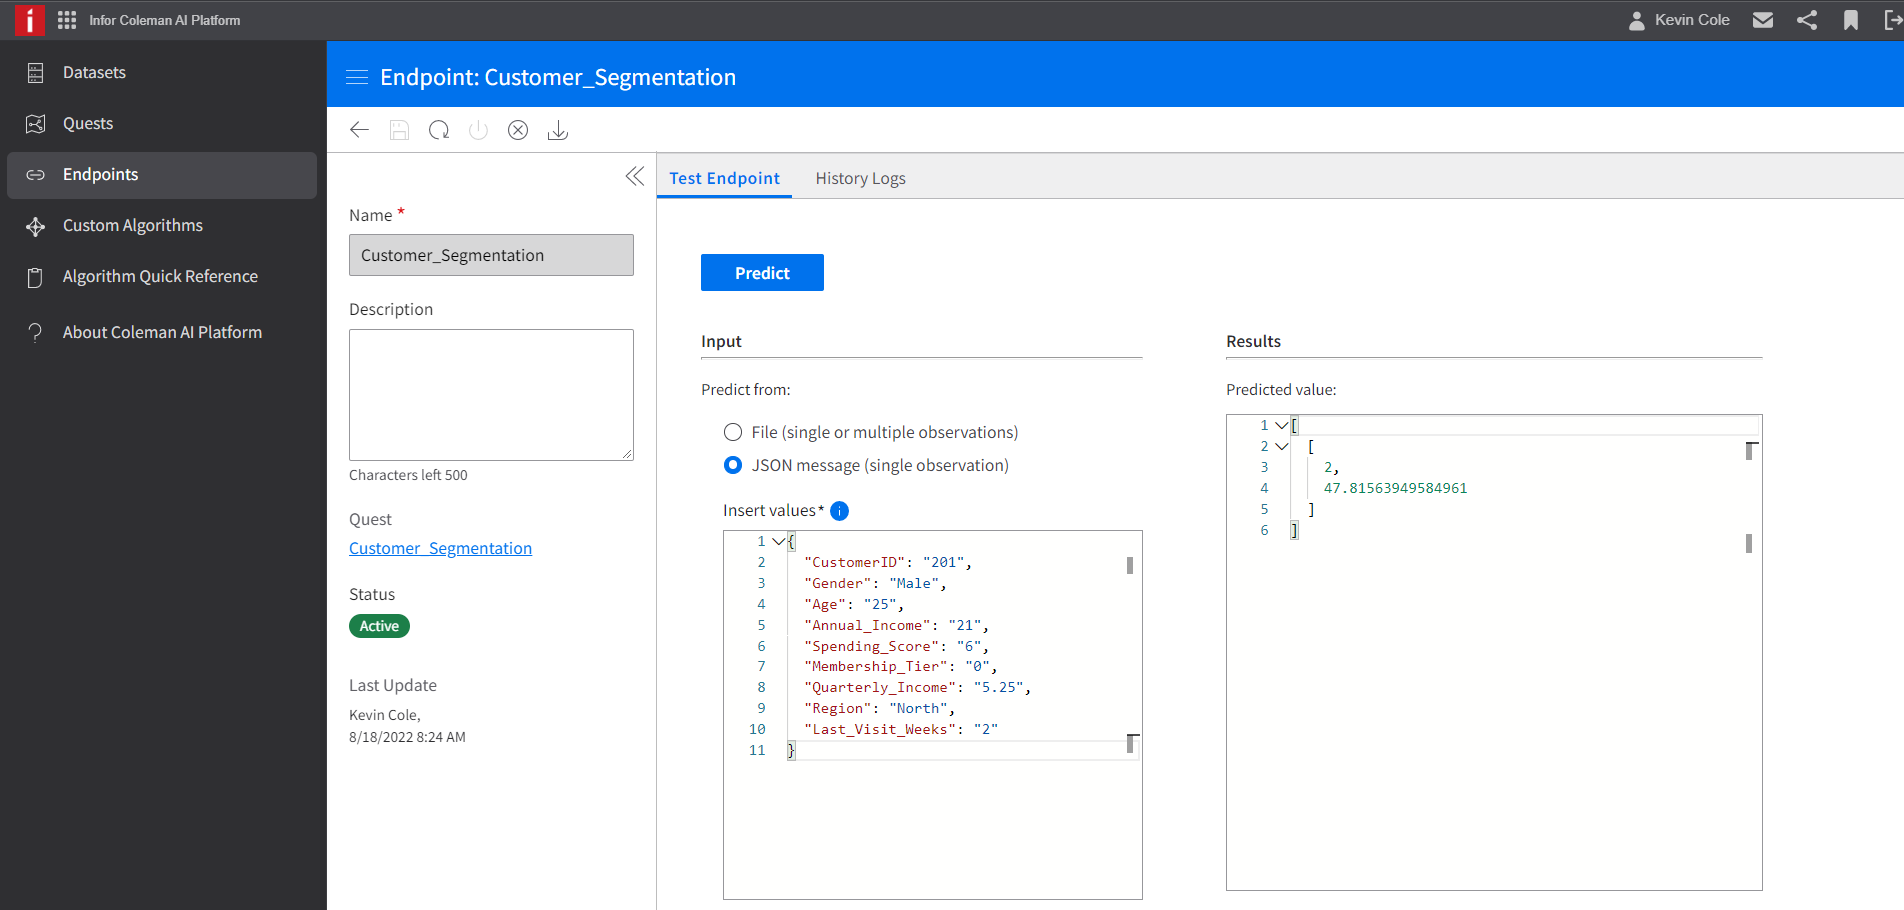
Step 10: Test the endpoint.
Navigate to the Endpoints section of Infor AI. Open your newly deployed endpoint and feed it some test data. This can be in the form of a file (CSV) or a JSON message as below. You can see that once a prediction is made, the endpoint returns two values, one is the integer value representing which customer group the new customer belongs to, and then a value representing the “distance” of that customer to the cluster center.
Step 11: Test the API
To access the endpoint via API, use the app switcher to navigate to Infor ION API, where you will find Infor AI Platform in the set of available API’s. You can use this API endpoint to query the model from applications or widgets.