Dynamically change Time Series Types in Reports
Business Problem
Users want to use different, non-standard time categories in their reports, and they prefer not having to use several reports or dashboard pages to do this.
Components
Requirements
- The right to Edit Dashboards, use Visualizer, Saved Expressions.
- A properly modeled dataset, specifically that the Measure comes from a fact table with a date, and that the date is connected to the Time dimensions, in other words, that the ‘Analyze By Date’ is toggled on.
- If you are using an Infor Cloudsuite, you can find the corresponding IFS roles in the CloudSuite Analytics documentation. For example, in M3 Analytics you need the ‘M3A Administration‘ role for Admin and Visualizer access.
Tutorial
Infor Birst has a great ability to quickly compare data between different periods.
All that’s needed is a measure, a date, and you can choose one of the following Time Series Types:


When building reports, there is no way to create additional custom time categories, like Trailing Half Year, Trailing Four Months, or any Weekly Time Series.
Also there could be customers that need to analyze data weekly, and while access to extra time categories can be enabled through support there is a way to develop these and more time categories in Visualizer.
In situations like this we can use the power of the function RSUM and build a report that will show data based on a Time Series we define.
In addition to time categories RSUM can calculate the trailing sum across any dimension, including text such as for example roman numerals I, II, III, IV.
1. Using RSUM to calculate the time category
For the Trailing N Months, we can simply use Running Sum or RSUM.
Birst has a built in Trailing 3 Months which we can replicate with a function: RSUM(window size,[ Measure]) where window size is the number of periods to consider, be it weeks, days or in this case, three months.
Using the BQL Editor, we can create expressions.

SavedExpression(‘Custom T3M’) = RSUM(3,[OrderDate: # Distinct OrderID]). We can easily change this to be Trailing 4, 5, 6 or any number of periods by changing the window size.

2. Display Filtering and making sure all the data you need is included in the report
You can see in the above image, that 01/2021 column only includes the data for that month.
This is controlled by the Filter/more options and can be changed.
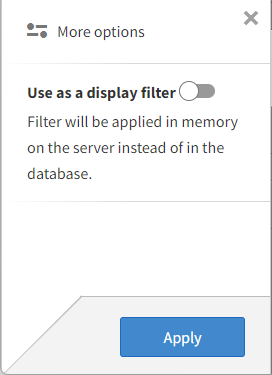
When ‘Use as a display filter’ is toggled off only the displayed data is used in the calculation.
When ‘Use as a display filter’ is toggled on all data is used in the calculation, and then only the relevant data is displayed.
Below is an image of the same report with ‘Use as a display filter’ toggled on.

Note that the same RSUM(3,[Measure]) will show three months data if the Date Dimension is monthly, it will show three days data if the Date Dimension is daily, and it will show three years data if the Date Dimension is yearly.
Furthermore, RSUM has no sense of time. So depending on the sorting used in the report, for January it can add Nov, Dec, and Jan when the months are sorted in descending order, but it will add Mar, Feb, Jan, if the order is ascending.
3. Non-standard
While Infor Birst already offers Month Ago, with RSUM we can achieve 2 months ago or 5 months ago.
The measurement for Month Ago is RSUM(2,[Measure]) – [Measure].
The measurement for 2 Months Ago is RSUM(3,[Measure]) – RSUM(2,[Measure]).
The measurement for Quarter Ago is RSUM(4,[Measure]) – RSUM(3,[Measure]).
The measurement for Year Ago is RSUM(13,[Measure]) – RSUM(12,[Measure]).