Dashboard filters of dynamically changing Measures and Dimensions
Overview
Interactivity allows users to explore data dynamically, uncover insights, and make informed decisions more effectively. Interactive elements enable users to customize their view, focus on specific data points, and discover trends or anomalies that might not be evident in static reports. This enhances user engagement, making the dashboard a tool for displaying information and a platform for data-driven exploration and decision-making.
This tutorial walks you through how to add interactivity to a dashboard by allowing the user to choose the attribute and/or measure they want to concentrate on.

Components
Requirements
- Edit Dashboard right (for dashboard filter editing)
- If Disable Filter Edit Access permission is enabled, the user can only create and edit Local Filters.
- If you are using an Infor Cloudsuite, you can find the corresponding IFS roles in the CloudSuite Analytics documentation. For example, in M3 Analytics you need the ‘M3A Administration‘ role for Edit Dashboard access.
Tutorial
Difficulty: Easy
Estimated Completion Time: 10 minutes
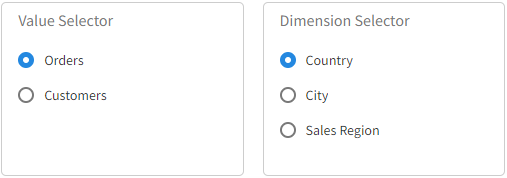
1. Create an embedded filter
The video below shows you how to create a filter with parameters that use the measures.
2. Create a Saved Expression
In Visualizer, Advanced Tools/BQL Editor, create a Saved Expression that will collect and interpret the values from the parameter.
ex: <EVAL!GetPromptValue(‘Value Selector’,'[OrderDate: # Distinct CustomerID]’)!>
GetPromptValue – captures the value provided by the parameter called Value Selector, as a string.
If the parameter is empty, then a default string is used, in this case [OrderDate: # Distinct CustomerID].
<EVAL! – evaluates the string as a Measure or Dimension.
3. Finally, use the newly created Saved Expression in your report as a regular Measure or Dimension.
3. Test the filters
The user will make a selection on the embedded filter.
Based on the users selection the filter will generate the corresponding parameter.

The GetPromptValue function will capture the value from the parameter, and <EVAL! will convert the captured string to a Measure or Dimension.
Resources
How to set up Dashboard Filters.
Basic Dashboard Filtering in the Birst How-to series on YouTube
Advanced Dashboard Filtering in the Birst How-to series on YouTube
Alternate solution: Creating Column Selector