Analytics & Reporting in M3 Cloudsuites
Configuring Context Message in the Visual Analytics Widget
Beginner | 10 Minutes
Overview
This Tutorial provides instructions for setting up an analytics widget with a context message in the Infor OS Portal. For our example, we will track the lowest price of an item within the last 30 days by directly selecting the item number in M3.
📋 Requirements
|
Tutorial
A video walk-through of the tutorial is available below.
1
Log in
Log in to the Infor OS Portal. Navigate to M3.
2
Access the widget catalog
On the right-hand side panel, select the widgets icon.
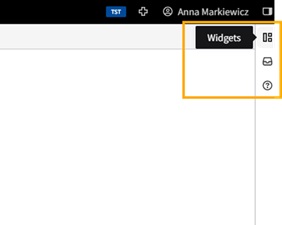
Use the dropdown under “Widgets” to select the “Add” option. Add the new insight group and name it, for example, Analytics Widgets.

3
Add widget
Open the widgets panel again and click the “Add Widget” button.
You can optionally pin the widgets panel to be visable using the pin icon.
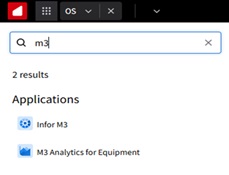
In the widget catalog, search for the widget you want to add. Here, we will use the analytics widget.
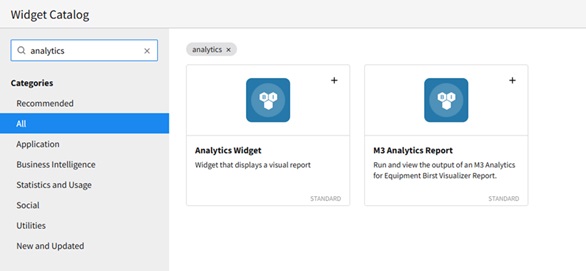
Once you locate the desired widget, click on + to add it to your smart panel. Close the catalog and click save.

4
Configure widget
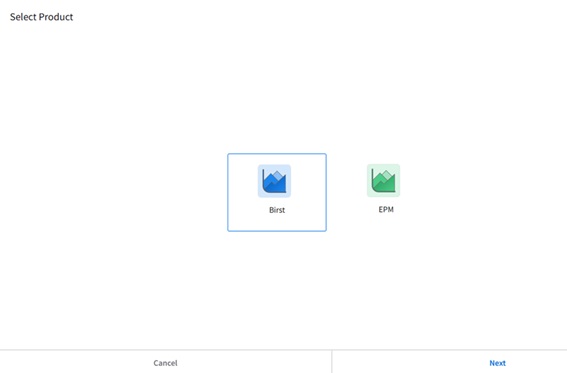
Click configure widget. Choose Birst and click next.
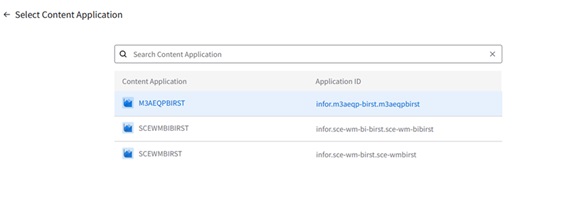
Select Analytics Application and click next.
Note: The names of your applications can differ from the image below. This depends on the CloudSuite application you are using.
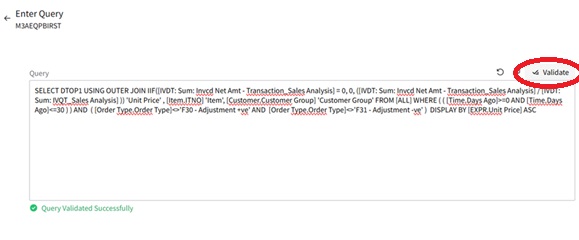
Copy and paste the below query from Birst Visualizer into the Query Field.
Note: This example query might not work in your environemnt. You can create a new report in Visualizer and then copy the query through the Advanced Tools/Queries option.
Confirm your query by clicking Validate to check the syntax, then click next.
5
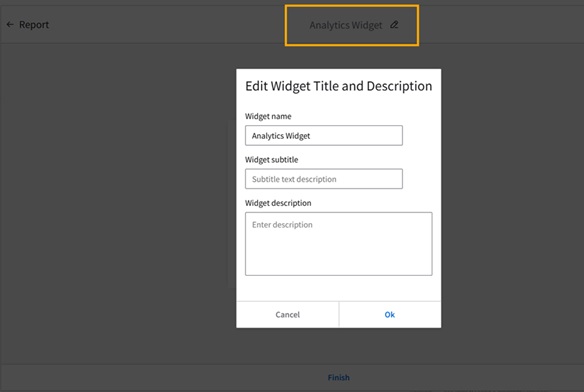
Rename widget
To rename the widget, click the edit icon, specify widget name and subtitle, and click Ok. In our example, we used “Lowest price of an item.”
6
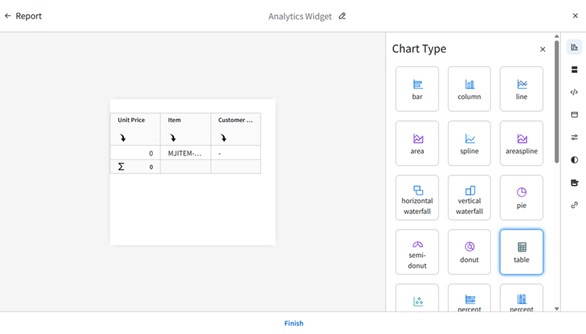
Set chart type
Set the chart type as a table.
7
Configure context message
Expand the mapping section. Choose an Operator (Greater than, Less than, or Equal). Select a Multiselect Type (AND or OR). Specify a Key Name/Path, in this case:
and the full name of a Column Name:
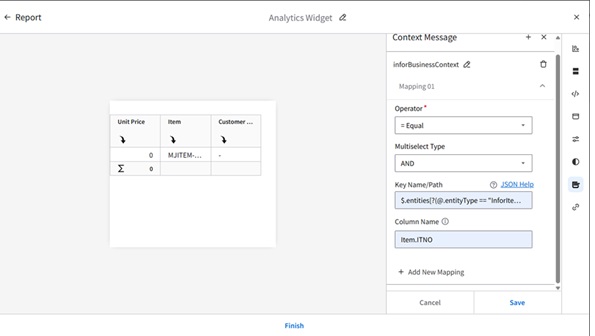
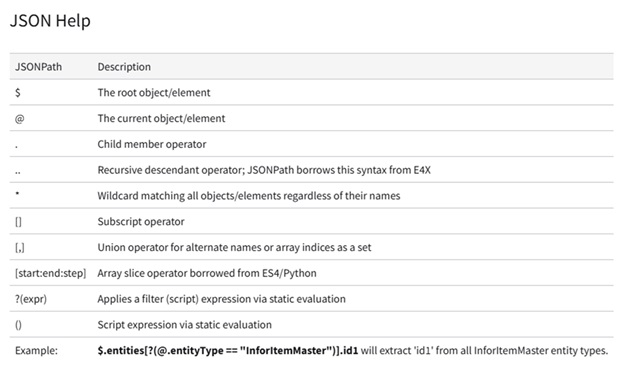
Click on the JSON Help for the guidelines:
Click Save
8
Finish and apply
Click finish to apply the changes and make sure it appers correctly in your Smart Panel.
You may need to adjust the placement and size of the widget within the Smart Panel to ensure it fits well with other widgets and provides a clear view of the analytics data.
9
Open M3
Open MMS001 program in M3
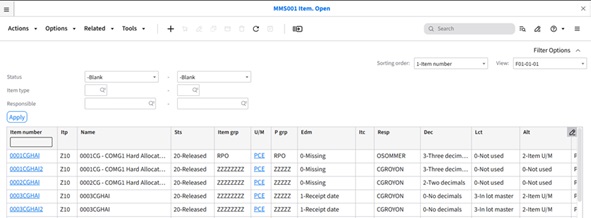
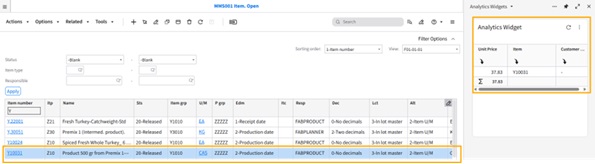
Review the data by selecting one item number from MMS001. The selected item's unit price appears in the analytics widget in the Smart Panel.
On this page
- Analytics & Reporting in M3 Cloudsuites